Blog Post
Builders are intentionally slowing sales
May 12, 2021
This is an article from Realtor Magazine. This is a once in a lifetime sellers market. Builders just like us around the country are forced to limit sales to be able to serve their customers.
© Dan Reynolds Photography / Moment / Getty Images
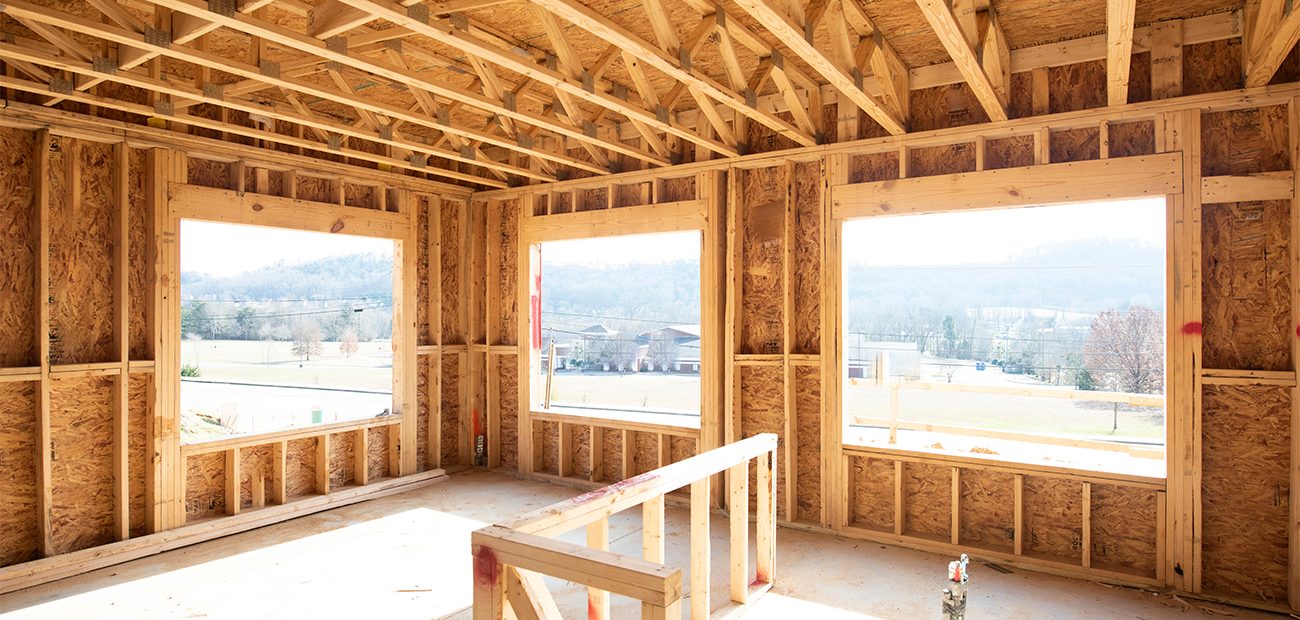
Builders Slow Production to Catch Up With DemandShare
March 22, 2021
Builders are slowing down production to catch up with a backlog of projects while trying to keep construction prices in check.
According to real estate analytics firm Zonda’s latest New-Home Pending Sales Index, which reflects February housing data, pending new-home sales fell month over month but are still up 35% annually across the country. Government data also showed a 10.3% decrease in February new-home construction. Builders are reporting that increases in material costs—notably on lumber—are continuing to challenge growth in new-home construction.
“Seventy percent of builders are intentionally slowing or pausing sales to better align contracts with production capacity, which makes drawing market conclusions more difficult,” says Ali Wolf, chief economist of Zonda, which is focused on the home building and multifamily industries. “The underlying demand in the housing market is still there, though, even as prices and mortgage rates rise.”
Still, pending new-home sales last month trended above year-ago levels in 22 of the 25 top markets Zonda tracks. The top-performing new-home markets in February were Jacksonville, Fla., Cincinnati, and San Antonio. But the numbers could be even higher if there was more inventory, economists note.
Zonda’s New-Home Pending Sales Index is a residential real estate indicator that is based on the number of new-home sales contracts signed across the country. The index is comprised of two components: new-home orders (which look at total sales and will fall based purely on limited supply) and the average sales rate per community (which captures how well builders are selling). Both gauges can be negatively impacted if builders intentionally cap sales. The following chart shows month-over-month and year-over-year changes in the two components for the top 25 markets.


- Whitestone Custom Homes
- 27241 Highland Crest
- San Antonio, TX 78260
- (210) 497-4334
- ©2026 Whitestone Custom Homes. All Rights Reserved.
- Site by: Builder Designs